14: Graphing Data: Visually Inspect Results
GRAPHS
Graphing your data allows you to visually inspect results and gain valuable information about the distribution that might not be evident through a data table.
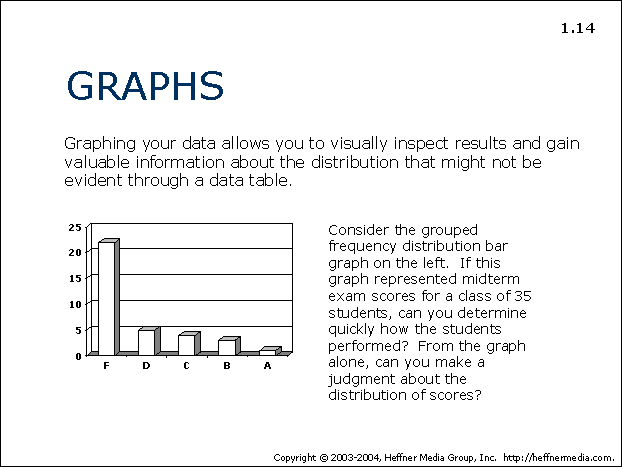
Consider the grouped frequency distribution bar graph on the left. If this graph represented midterm exam scores for a class of 35 students, can you determine quickly how the students performed? From a graph alone, can you make a judgment about the distribution of scores?
